Weekly Launch Radar: What to Monitor and What Is Noise
A weekly property launch radar compares dated observations about competing developments on a recurring basis. A listing change does not, by itself, establish a…
Imovitec · October 13, 2026
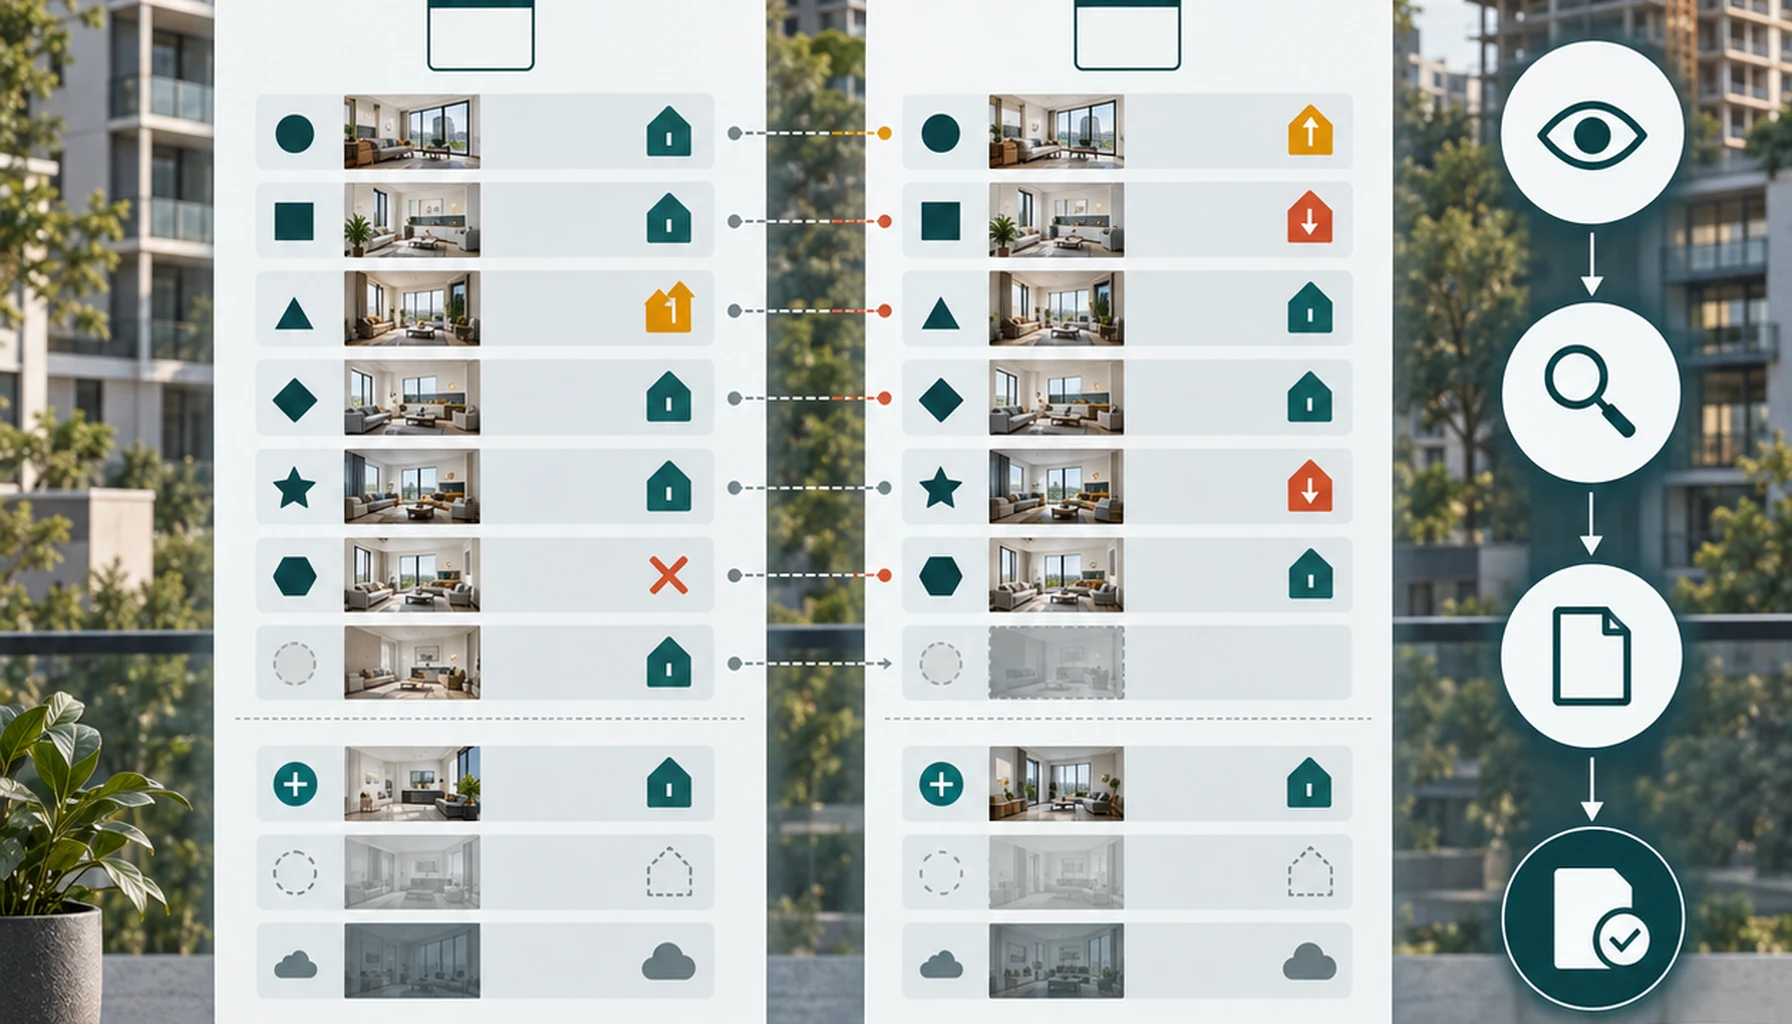
A weekly property launch radar compares dated observations about competing developments on a recurring basis. A listing change does not, by itself, establish a sale or market trend. The radar instead identifies what warrants continued observation, investigation, or documentary confirmation.
For a real estate market intelligence team, conclusions should never outrun the evidence. A changed asking price is an observation. So is a unit disappearing from a portal. Considered alone, neither proves a transaction, a demand shift, or movement in realized value.
Key takeaways
A dependable weekly radar compares the same identifiable units across dated snapshots. New entries and unexplained exits stay outside the matched panel, while persistent or consequential changes receive priority. Monthly and quarterly indicators add context, but differences in frequency and coverage prevent them from independently validating a one-week movement.
- Monitor stable unit identifiers, advertised prices, displayed availability, source, capture date, and collection status.
- Treat a single change as an observation, not a confirmed sale or trend.
- Separate matched units from new entries, unexplained exits, and collection failures.
- Investigate repeated changes and seek documentary confirmation for material claims.
- Do not publish a VSO benchmark until its concept, denominator, period, coverage, and treatment of cancellations are compatible.
Weekly launch radar: a recurring comparison of dated, matched observations used to classify changes for observation, investigation, or confirmation.
What should a weekly launch radar monitor?
Fields that remain comparable from one capture to the next belong in the radar: development, unit, advertised price, displayed status, source, and observation date. Collecting numerous unstable attributes is less useful than matching units reliably. When a unit cannot be identified with confidence, keep it outside the paired comparison.
Begin with a durable identification key. Depending on the authorized source, that key might combine the development, tower, floor, unit number, floor plan, or another documented reference.
A practical record includes:
- development and source;
- capture date and reference period;
- stable unit identifier;
- unit type and area, when consistently disclosed;
- advertised price and the documented meaning of that field;
- displayed availability or commercial status;
- collection result, including failed or incomplete captures;
- evidence location, such as a dated page or authorized file;
- an analyst note that separates observation from interpretation.
This structure complements What Is a Real Estate Radar, and Why Does the Market Need One?. When a source revises its layout or terminology, the same structure also creates an auditable path for corrections.
Which weekly changes are signals worth investigating?
A signal is a comparable change that clears basic quality checks and could affect a decision. Attention becomes more appropriate when the change persists across captures, occurs among related units, or has documentary support. Persistence strengthens the reason to investigate. It does not reveal the cause.
A change in advertised price
Compare the asking price for the same unit in consecutive weekly captures.
Weekly advertised-price change equals the current week’s advertised price divided by the previous week’s advertised price, minus one, multiplied by 100.
Express the result as a percentage. The denominator is the same unit’s advertised price in the prior week, and the comparison period is week over week. Before publication, document the rounding rule. Never impute missing prices, and report withdrawn or unavailable units separately.
This is a proposed calculation for an authorized proprietary dataset, not an official market statistic. More precisely, it measures movement in the observed asking price.
What does that price represent? The Fundação Instituto de Pesquisas Econômicas states that the FipeZAP Index draws on samples of properties advertised for sale and rent. This supports a distinction between advertised and transacted prices, but it does not measure the gap between them. Review the current methodology, filters, weighting, treatment of duplicates, and city coverage before attempting detailed comparisons (Fipe, “Índice FipeZAP,” accessed October 13, 2026).
Apply the same safeguards described in How to Read a Competitor’s Sales Table Without Confusing List Price with Realized Price.

A change in displayed availability
Limit the availability comparison to units observed in both captures.
Availability-change rate equals the number of matched units whose displayed status changed, divided by all comparable units observed in both weeks, multiplied by 100.
The output is a weekly percentage. Its denominator is the matched panel, rather than every unit present in either snapshot. Exclude new entries, unexplained exits, and collection failures, or disclose them separately. The rounding convention also needs to be recorded.
Crucially, this metric is not a sales rate. A displayed status change could reflect an operational update, reservation, block, correction, or another event. Those possibilities remain hypotheses because the primary sources recovered for this analysis do not explain the operating rules of the monitored portals.
A repeated or clustered change
Repeated movement becomes more useful for triage when it continues in later captures or affects comparable units within the same development. That pattern may justify investigation. Without compatible evidence, however, it still cannot establish demand, a pricing strategy, or a sale.
Record the exact change, the comparable-unit universe, the duration of the pattern, and the evidence that could confirm or reject the working hypothesis. This discipline prevents a plausible interpretation from quietly becoming an unsupported market claim.
What counts as noise in a weekly radar?
Noise is an observation whose meaning cannot yet be distinguished from source behavior, a collection failure, or a shift in panel composition. Preserve it in the audit trail, but leave it out of the headline conclusion. Calling something noise describes weak evidence, not low commercial importance.
Typical categories include:
- a unit appearing for the first time, with no comparable prior observation;
- a unit disappearing without a documented reason;
- a blank price or status caused by incomplete collection;
- a changed label whose commercial meaning is unknown;
- duplicate records or unstable identifiers;
- a one-week movement that reverses in the next capture.
That final category is a practical classification rule, not a sourced law of market behavior. Each team needs a documented persistence threshold and should not present it as an industry standard.
Operational noise: a recorded change that cannot yet be distinguished from source behavior, collection error, or panel-composition effects.
A historical publication from 2017 and a release covering the fourth quarter of 2025 confirm that cadence.
Does a removed, reserved, or blocked unit mean it was sold?
No. Without documentary confirmation, a removed, reserved, or blocked unit should not be reported as sold. The visible status establishes only what the source displayed at a given time. It does not necessarily prove the underlying transaction or its commercial terms.
Use a four-level evidence ladder:
- Observation: a dated capture records the change.
- Investigation: the analyst checks matching, source integrity, and surrounding records.
- Documented hypothesis: a plausible explanation is recorded with alternatives and limitations.
- Confirmation: an authorized document or sufficiently reliable record supports the claimed event.
Reports should state the applicable level. “Unit absent from this week’s source” is an observation. “Possible commercial-status change, pending confirmation” is a hypothesis. Describing a sale as confirmed requires evidence that actually supports a sale.
Talk to a specialist
Want to see this applied to your case?
Instead of finishing the article and staying in theory, send us your situation on WhatsApp. We reply with the concrete next step.
How should weekly observations be compared with monthly and quarterly indicators?
Weekly observations and broader market indicators operate at different analytical levels. Monthly or quarterly series can supply context after their concepts, coverage, periods, and revision rules have been checked. Because of their slower cadence, they cannot independently confirm movement seen during one week.
ABRAINC, the Brazilian Association of Real Estate Developers, and Fipe publish monthly indicators for launches, sales, deliveries, final supply, and cancellations in Brazil’s primary residential market. The pages recovered do not resolve every current operational definition, geographic boundary, panel rule, or revision policy.
Scope matters here. A January 2023 report covering November 2022 says its data were provided by ABRAINC member developers. The series therefore should not be treated as a complete portrait of Brazil (ABRAINC, “Indicador Mensal, ABRAINC-Fipe,” accessed October 13, 2026; Fipe and ABRAINC, January 2023 report).
CBIC, the Brazilian Chamber of the Construction Industry, publishes quarterly indicators on launches, sales, and property supply. A historical publication from 2017 and a release covering the fourth quarter of 2025 confirm that cadence. The latest complete methodology and coverage were not recovered, so current numerical benchmarks require further review before use (CBIC, “Indicadores Imobiliários Nacionais 2017,” 2017; CBIC, fourth-quarter 2025 release).
Monthly real estate market information also comes from the Central Bank of Brazil, which states that it updates the information on the last business day of each month. Before using a series, inspect its metadata for the applicable concept, lag, and revision rule (Central Bank of Brazil, “Informações do Mercado Imobiliário,” accessed October 13, 2026).
ABECIP, the Brazilian Association of Real Estate Credit and Savings Entities, issues monthly reports on mortgage financing funded through the Brazilian Savings and Loan System, SBPE. This institutional series does not cover every source of financing (ABECIP, “Informativos mensais,” accessed October 13, 2026).
For a fuller separation of observation frequencies, see Weekly Market Data for Real Estate Developers.
Can VSO or IVV validate a weekly movement?
Not without compatible definitions and periods. The material recovered does not confirm a single official VSO formula that can be compared directly across ABRAINC/Fipe, CBIC, and local sources. The treatment of initial inventory, launches, gross or net sales, cancellations, reservations, and blocked units remains unresolved.
For that reason, both a VSO formula and a numerical benchmark are blocked in this analysis. Before comparing a sales-velocity indicator, retrieve the current methodology, identify the relevant market and segment, verify the time window and denominator, and document how missing data are handled.
The conceptual differences are examined in VSO vs. IVV: Which Indicator to Use, for What Period, and What Neither Measures.

How should the weekly report present evidence?
A decision-ready report separates the observed change from its interpretation and any confirmation still required. The summary may be brief, but every statement needs to retain its scope and limitation. For each highlighted item, identify the unit universe, dates, source, exclusions, matched-panel denominator, and evidence level.
Use three queues:
- Observe: isolated but valid changes with no immediate decision impact.
- Investigate: persistent, clustered, or consequential changes that passed matching checks.
- Confirm before reporting as fact: sales, realized prices, demand shifts, and market trends.
Put new entries, unexplained exits, and collection failures in a reconciliation section. The consequence is practical: the radar remains useful without assigning conclusions that its evidence cannot support.
Why is a weekly radar a triage system rather than a trend machine?
Paired captures reveal where something changed, but not necessarily why. That is why a weekly radar functions as a triage system. Persistence helps prioritize an inquiry, compatible external series contribute context, and documents support claims that cannot safely rest on portal behavior alone.
More alerts are not the objective.
Reducing false certainty is. This hierarchy gives market intelligence teams a defensible response to three weekly questions: what should remain under observation, what deserves investigation, and what cannot yet be concluded?
FAQ
How do I read a weekly residential launch radar?
Read a weekly residential launch radar by comparing dated observations for the same identifiable units. Review advertised price, availability status, new entries, unexplained exits, and persistence across snapshots. Treat each change as a signal for observation or investigation, not as proof of a sale, demand shift, or market trend.
What does a property launch radar detect?
A property launch radar detects observable changes in competing developments, including advertised prices, unit availability, project entries, and listing exits. It does not directly detect completed transactions or realized prices. Those conclusions require documentary confirmation and consistent evidence beyond a single portal update or weekly snapshot.
What's the best way to separate a real market signal from noise?
The best way to separate signal from noise is to require comparability, persistence, and corroboration. Match the same units across dated snapshots, isolate collection failures and unexplained exits, and investigate consequential changes. A single altered listing is an observation; repeated changes or documentary confirmation provide stronger grounds for reporting.
How often should residential launches and availability be monitored?
Residential launches and availability can be screened weekly, while broader indicators should be used at their published frequency. ABRAINC/Fipe and relevant BCB information are monthly, while CBIC market results are quarterly. These sources provide context, but they cannot independently confirm a change observed during one week.
Is an advertised price the same as a transaction price?
An advertised price is not necessarily the price paid in a completed transaction. FipeZAP measures price movements using property listings, so its figures concern asking prices. Weekly listing changes may support monitoring and investigation, but claims about realized value require transaction evidence or another source designed to measure completed deals.
Is weekly monitoring worth the cost for a market-intelligence team?
Weekly monitoring is worthwhile when it improves decision triage without creating false certainty. Its return should be assessed through actionable investigations, avoided reporting errors, and time saved by documented rules, not by counting every detected change. A narrow comparable panel may deliver more decision value than broad, inconsistent collection.
Can weekly radar findings be compared across cities, segments, and data sources?
Weekly radar findings are comparable only when definitions, coverage, frequency, and unit identification are compatible. Teams should document inclusion rules, paired panels, missing observations, reservations, blocks, and cancellations. VSO should not be compared across sources until its denominator, period, sales treatment, and cancellation rules have been verified.
Talk to a specialist
Have a real case to solve?
Message Imovitec on WhatsApp. We reply fast and already speak your context — no forms, no waiting.
Frequently asked questions
How do I read a weekly residential launch radar?
Read a weekly residential launch radar by comparing dated observations for the same identifiable units. Review advertised price, availability status, new entries, unexplained exits, and persistence across snapshots. Treat each change as a signal for observation or investigation, not as proof of a sale, demand shift, or market trend.
What does a property launch radar detect?
A property launch radar detects observable changes in competing developments, including advertised prices, unit availability, project entries, and listing exits. It does not directly detect completed transactions or realized prices. Those conclusions require documentary confirmation and consistent evidence beyond a single portal update or weekly snapshot.
What's the best way to separate a real market signal from noise?
The best way to separate signal from noise is to require comparability, persistence, and corroboration. Match the same units across dated snapshots, isolate collection failures and unexplained exits, and investigate consequential changes. A single altered listing is an observation; repeated changes or documentary confirmation provide stronger grounds for reporting.
How often should residential launches and availability be monitored?
Residential launches and availability can be screened weekly, while broader indicators should be used at their published frequency. ABRAINC/Fipe and relevant BCB information are monthly, while CBIC market results are quarterly. These sources provide context, but they cannot independently confirm a change observed during one week.
Is an advertised price the same as a transaction price?
An advertised price is not necessarily the price paid in a completed transaction. FipeZAP measures price movements using property listings, so its figures concern asking prices. Weekly listing changes may support monitoring and investigation, but claims about realized value require transaction evidence or another source designed to measure completed deals.
Is weekly monitoring worth the cost for a market-intelligence team?
Weekly monitoring is worthwhile when it improves decision triage without creating false certainty. Its return should be assessed through actionable investigations, avoided reporting errors, and time saved by documented rules, not by counting every detected change. A narrow comparable panel may deliver more decision value than broad, inconsistent collection.
Can weekly radar findings be compared across cities, segments, and data sources?
Weekly radar findings are comparable only when definitions, coverage, frequency, and unit identification are compatible. Teams should document inclusion rules, paired panels, missing observations, reservations, blocks, and cancellations. VSO should not be compared across sources until its denominator, period, sales treatment, and cancellation rules have been verified.
Imovitec
Turn data into next steps.
Take the Imovitec diagnostic and see where your best opportunities are.